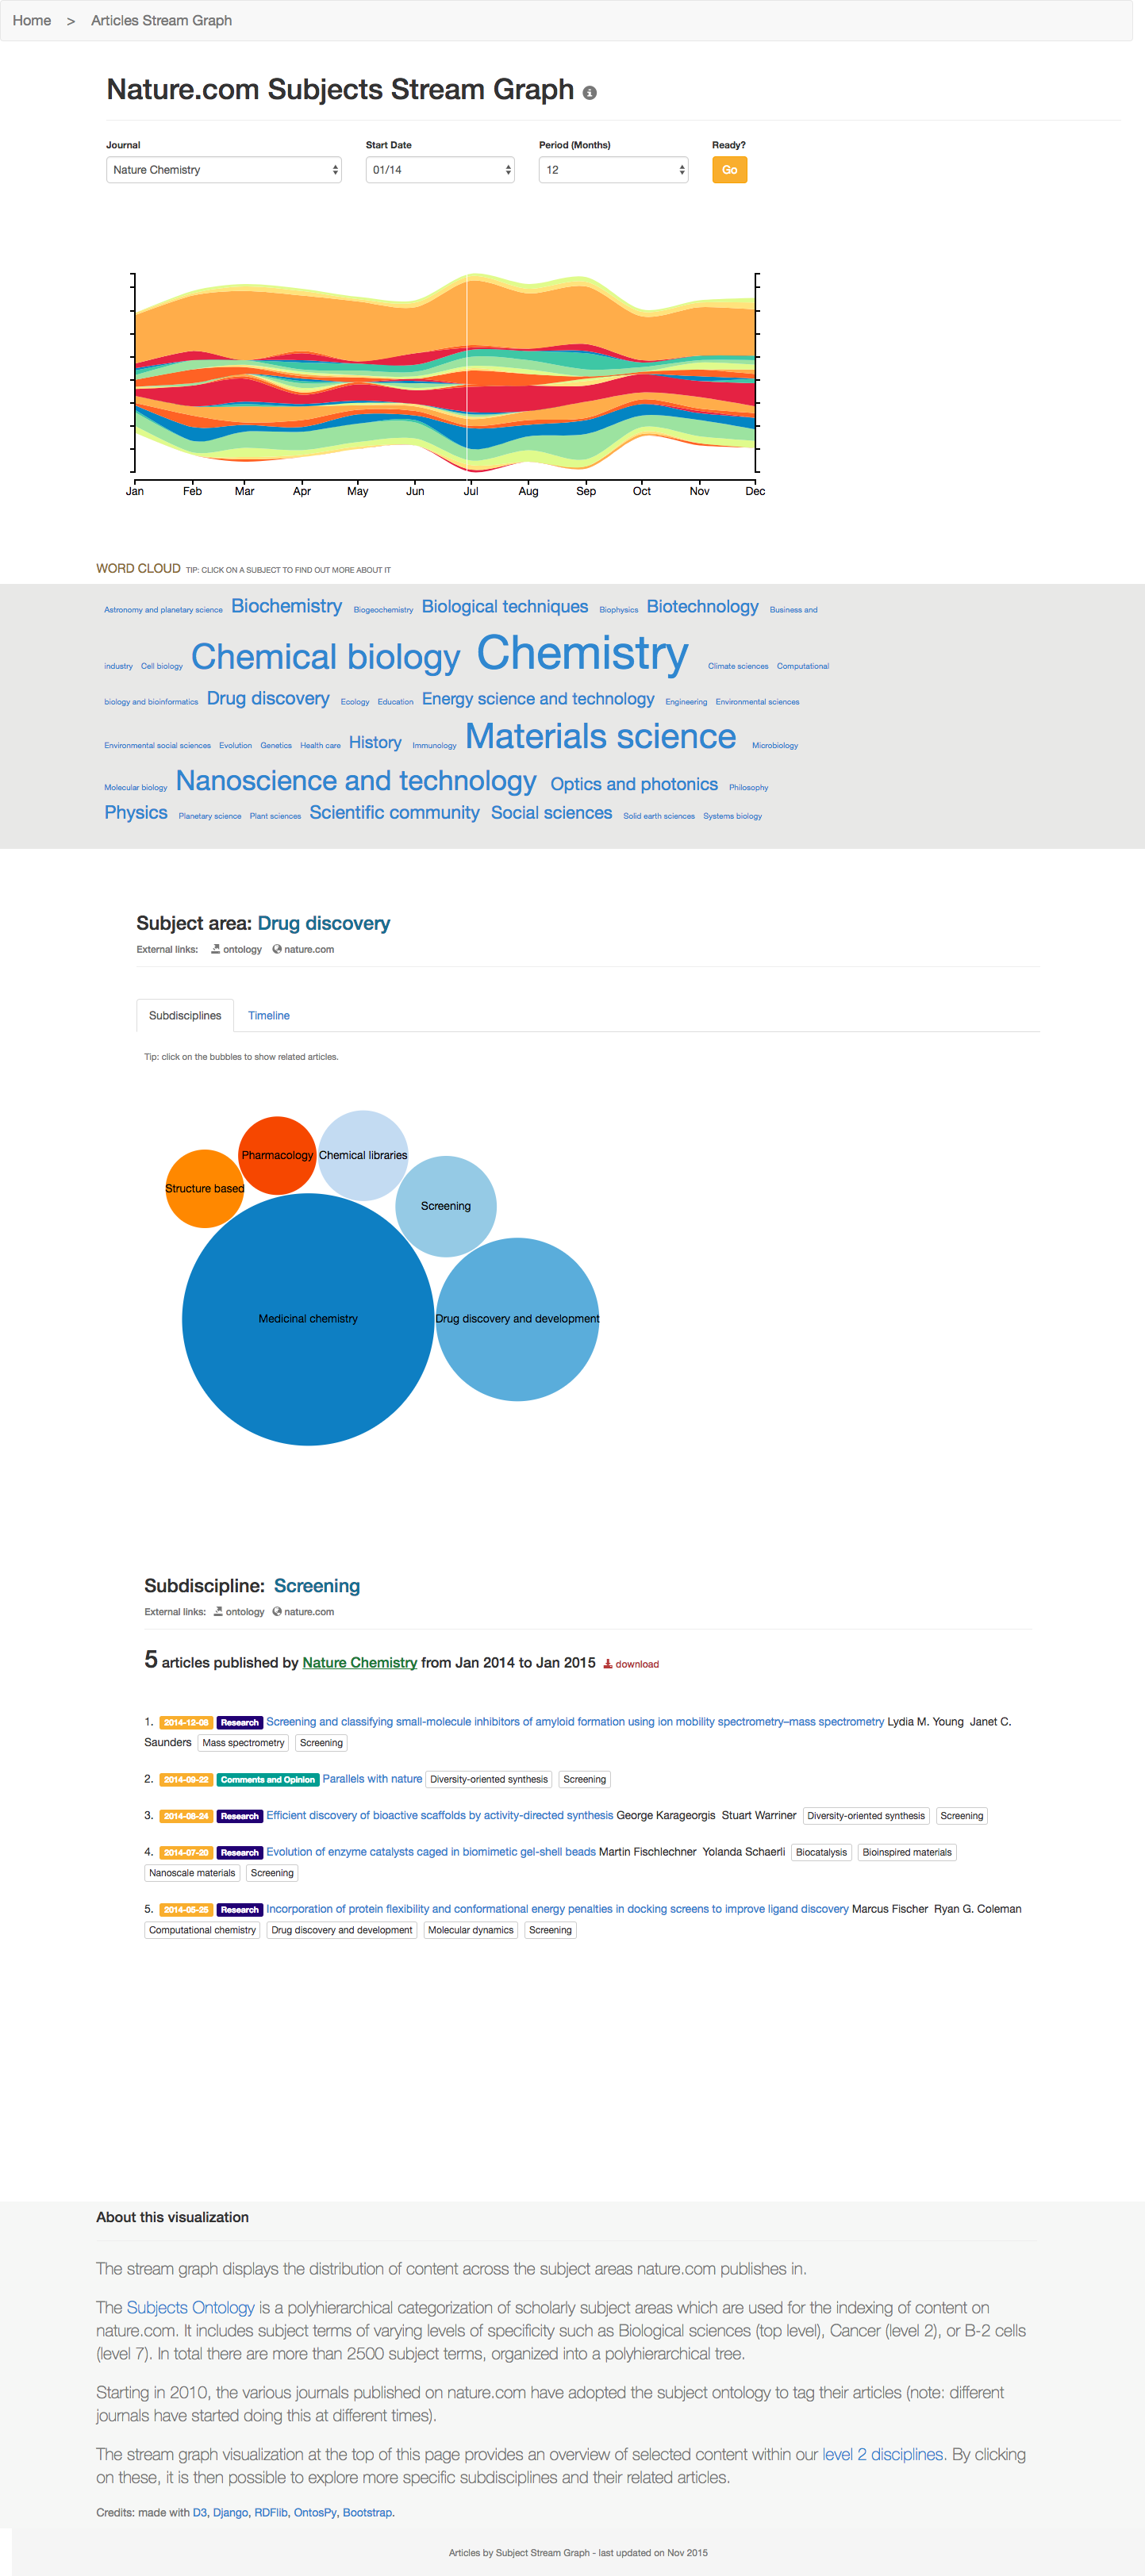
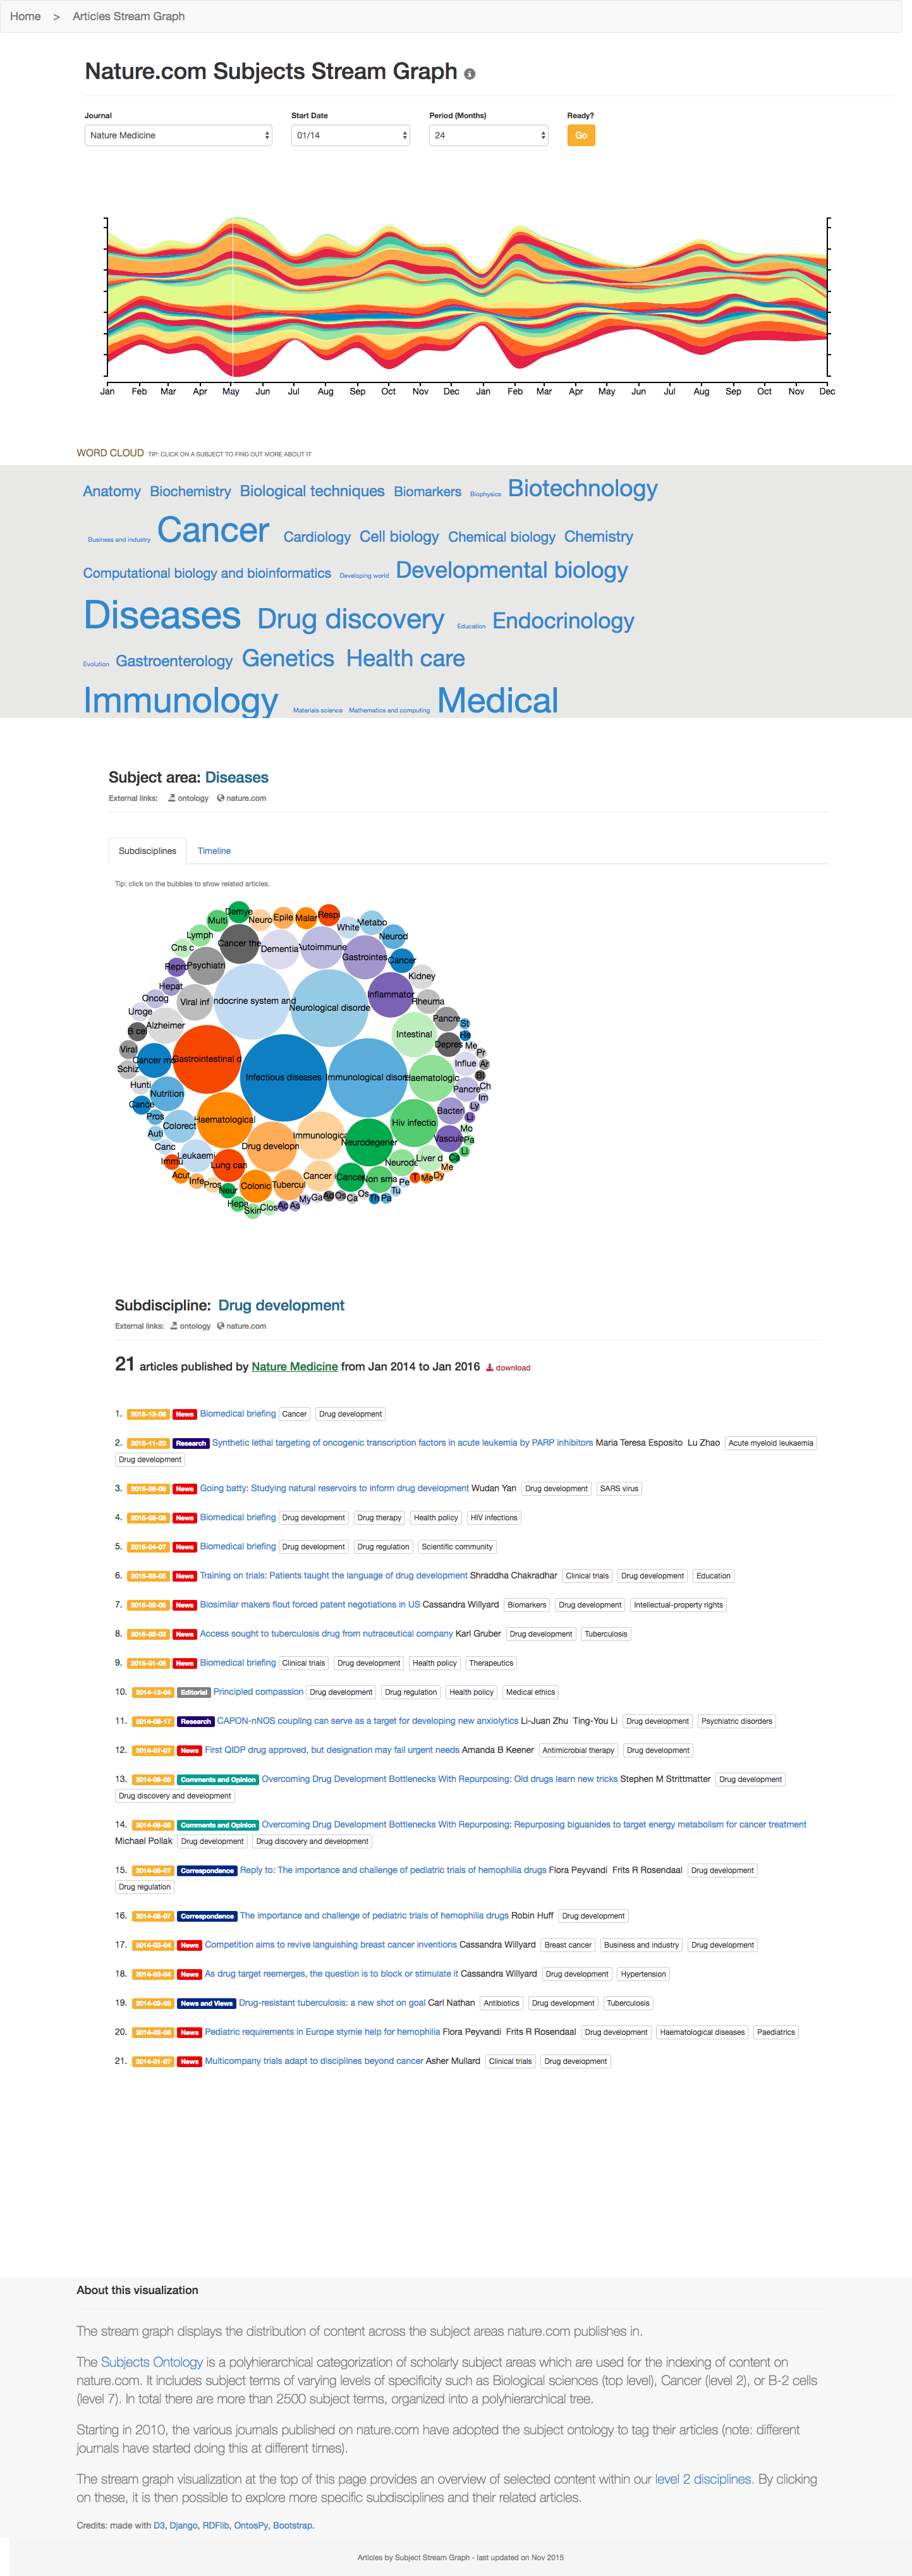
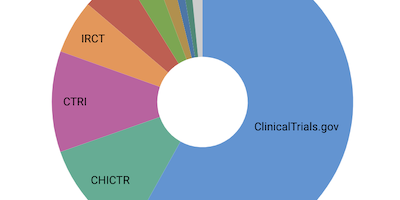
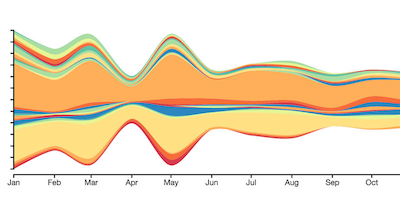
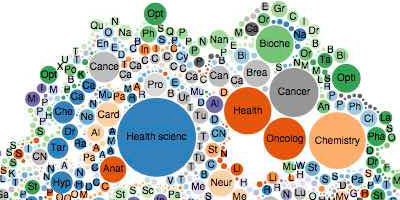
The nature.com subjects stream graph displays the distribution of content across the subject areas of the journals accessible on the nature.com portal.
This is an experimental interactive visualisation based on a freely available dataset from the nature.com linked data platform, which I've been working on in the last few months.
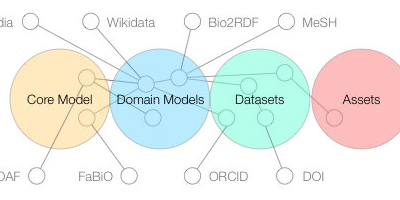
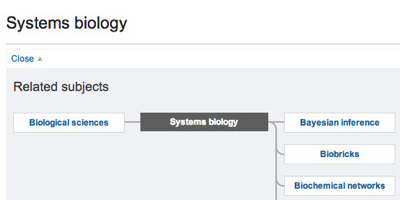
The main visualization provides an overview of selected content within the level 2 disciplines of the Subjects Ontology. By clicking on these, it is then possible to explore more specific subdisciplines and their related articles.
Role:
Design and implementation
Date: Jun 2015 - Jan 2016
Date: Jun 2015 - Jan 2016
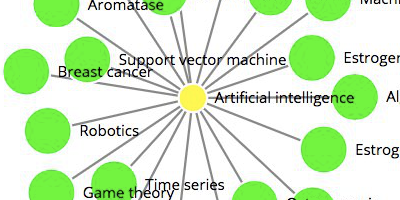
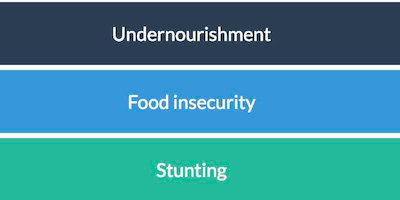
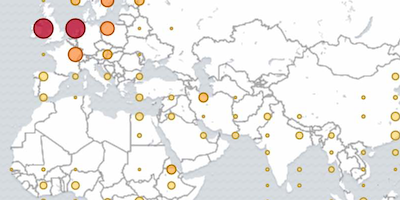
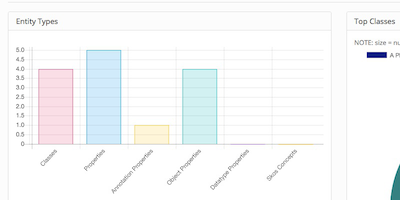
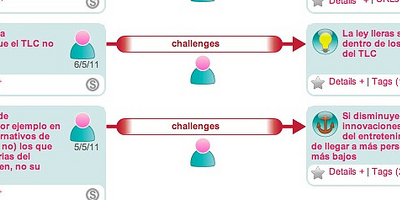
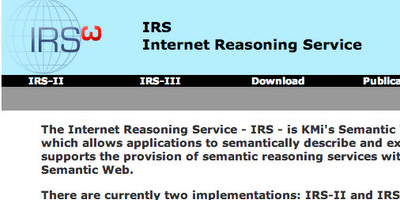
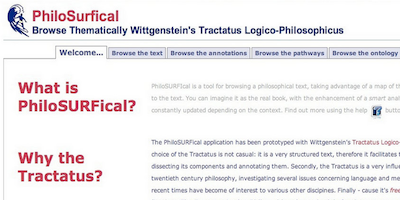
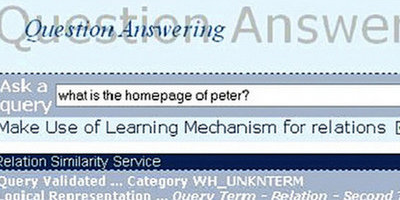
Screenshots: